Denmark tops the ranking of the most sustainable countries in the world according to the latest data from the Environmental Performance Index
The Environmental Performance Index (EPI) evaluates and ranks 180 countries on 40 performance indicators across 11 categories covering environmental health and ecosystem vitality.
The aim is to gauge, at a national scale, how close countries are to meeting the environmental policy goals outlined in the United Nations 2015 Sustainable Development Goals (SDGs) and the Paris Climate Agreement.
What is the Environmental Performance Index?
The EPI has been running biennially since 2006. It was preceded by the Environmental Sustainability Index (ESI), published between 1999 and 2005. Both were developed by Yale University and Columbia University in collaboration with the international non-governmental World Economic Forum and the Joint Research Centre of the European Commission.
The EPI report has become the world’s premier framework for global environmental policy analysis. The report is compiled every two years using the following categories to create an EPI score out of 100 for every nation.
- Climate Change
- Air Quality
- Sanitation & Drinking Water
- Heavy Metals
- Waste Management
- Biodiversity & Habitat
- Ecosystem Services
- Fisheries
- Acid Rain
- Agriculture
- Water Resource
The report found that global progress to reduce greenhouse gas (GHG) emissions remain insufficient to meet the net-zero GHGs by the mid-century target established in the 2021 Glasgow Climate Pact.
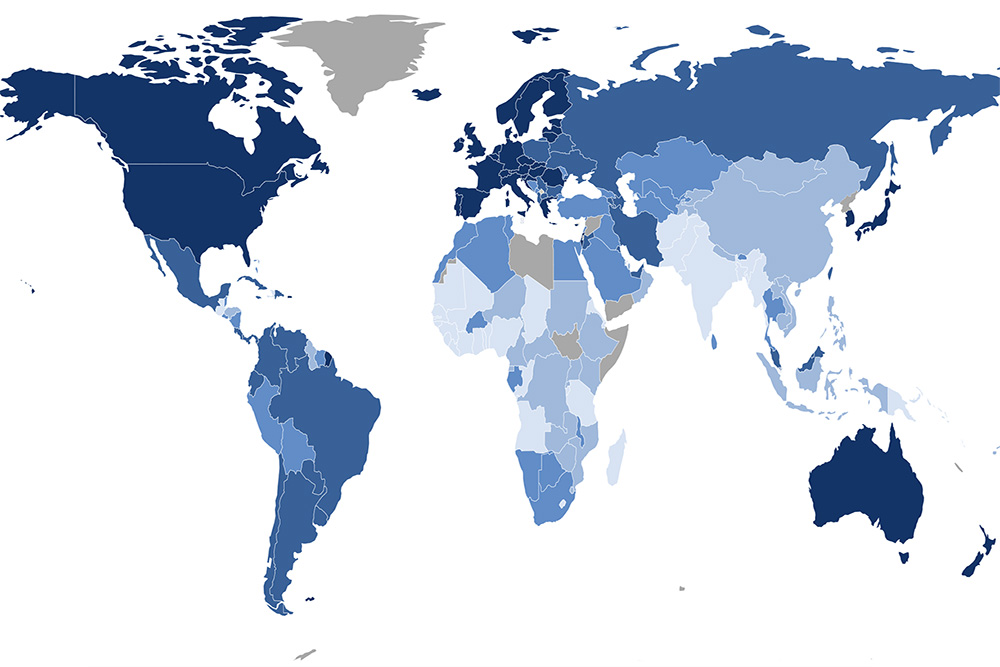
Using emissions trajectory from the last 10 years as a basis for projecting 2050 emissions, the EPI researchers forecast that the vast majority of countries will not achieve the net-zero goal. A number of nations – including the USA – are projected to fall far short of the target.
“Major countries have much more work to do than they
Martin Wolf, EPI Principal Investigator
may have realized if the world is to avoid the potentially devastating impacts of climate change.”
Only a handful of countries – notably Denmark and the UK – are presently projected to reach GHG neutrality by 2050. The countries performing well on the net-zero GHG in 2050 metric have enacted some of the world’s most ambitious climate policies.
10 most sustainable countries
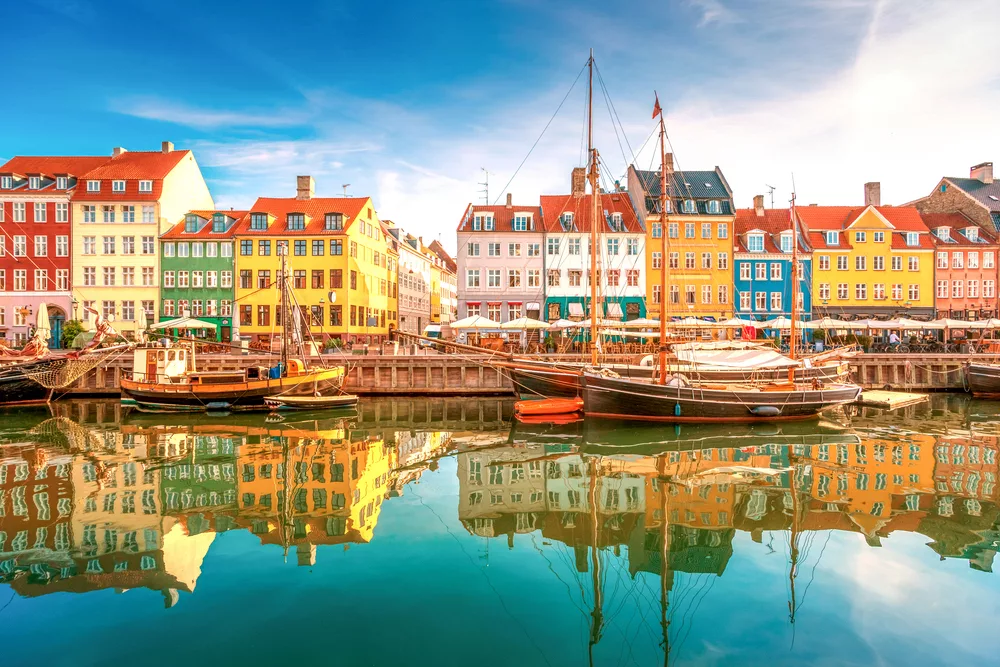
Denmark is the most sustainable country in the world. Denmark has set a national target of reducing 2030 emissions by 70% compared to the 1990 level and has adopted an exhaustive policy agenda to deliver on this commitment, including recently expanded GHG taxes.
Other high-scoring nations include the UK and Finland, both of which scored well in the climate change category, their performances driven by policies that have substantially cut GHGs in recent years. Sweden and Switzerland, also among the top countries, performed well in terms of air and water quality.
- Denmark
- UK
- Finland
- Malta
- Sweden
- Luxembourg
- Slovenia
- Austria
- Switzerland
- Iceland
Lagging behind its peers, the USA was ranked 43rd. This relatively poor performance reflects inaction in Washington on critical issues such as climate change; the rollback of environmental protections during the Trump administration; and the country’s temporary withdrawal from the Paris Climate Agreement.
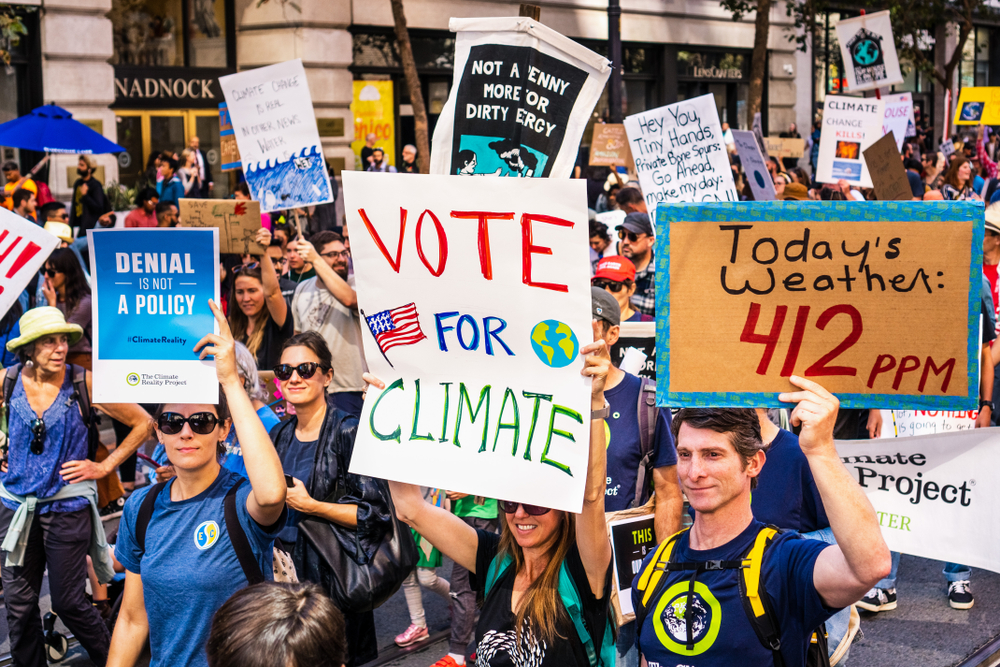
While the data suggests the USA is improving air quality and marine protected areas, the ranking still puts it behind most industrialised Western democracies, including France (12th), Germany (13th), Australia (17th), Italy (23rd) and Japan (25th).
10 least sustainable countries
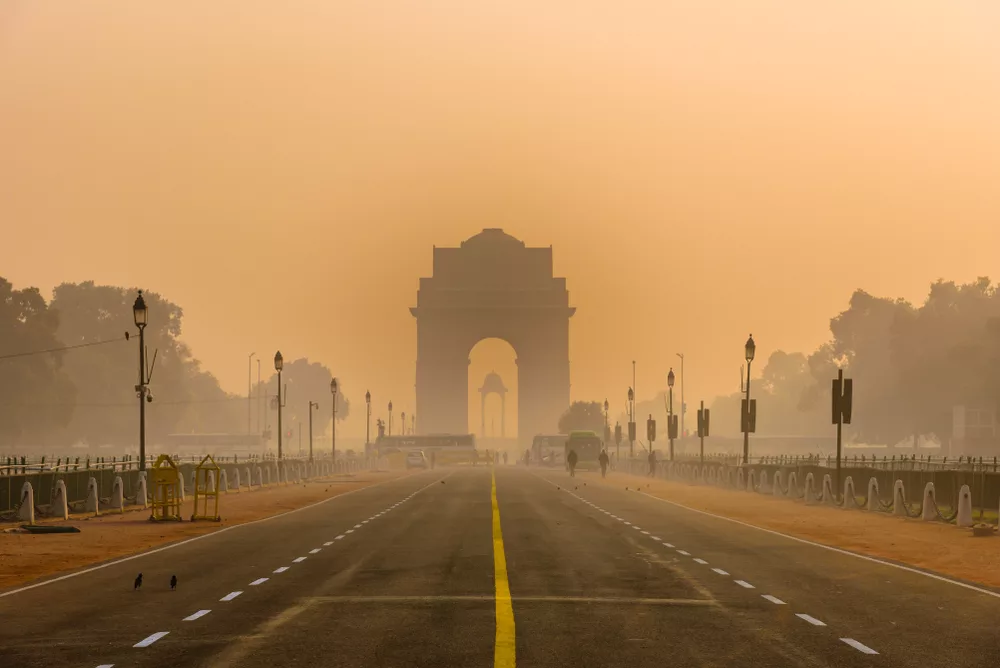
India is the least sustainable country in the world. Generally, the lowest scores went to countries struggling with civil unrest and other crises (such as Myanmar or Haiti) or nations that have prioritised economic growth over environmental sustainability, such as India, Vietnam, Bangladesh and Pakistan.
- India
- Myanmar
- Vietnam
- Bangladesh
- Pakistan
- Papua New Guinea
- Liberia
- Haiti
- Turkey
- Sudan
India, with its markedly poor air quality and quickly rising emissions,
is ranked last for the first time in the history of the index. Poor air quality and growing GHG emissions continue to impact China, placing the nation 160th out of 180 countries.
complete rankings
The world’s most sustainable countries are scored and ranked on their environmental performance using the most recent year of data available. The ranking also includes how scores have changed over the previous decade.
Some nations are missing due to insufficient data.
| Rank | Country | EPI Score | 10-year change |
|---|---|---|---|
| 1 | Denmark | 77.9 | 14.9 |
| 2 | UK | 77.7 | 23.0 |
| 3 | Finland | 76.5 | 21.0 |
| 4 | Malta | 75.2 | 25.4 |
| 5 | Sweden | 72.7 | 15.8 |
| 6 | Luxembourg | 72.3 | 13.5 |
| 7 | Slovenia | 67.3 | 8.6 |
| 8 | Austria | 66.5 | 7.2 |
| 9 | Switzerland | 65.9 | 8.2 |
| 10 | Iceland | 62.8 | 4.4 |
| 11 | Netherlands | 62.6 | 5.9 |
| 12 | France | 62.5 | 6.4 |
| 13 | Germany | 62.4 | 2.2 |
| 14 | Estonia | 61.4 | 6.1 |
| 15 | Latvia | 61.1 | 8.2 |
| 16 | Croatia | 60.2 | 17.2 |
| 17 | Australia | 60.1 | 10.3 |
| 18 | Slovakia | 60 | 3.2 |
| 19 | Czech Rep | 59.9 | 5.2 |
| 20 | Norway | 59.3 | 5.8 |
| 21 | Belgium | 58.2 | 6.1 |
| 22 | Cyprus | 58 | 6.0 |
| 23 | Italy | 57.7 | 6.0 |
| 24 | Ireland | 57.4 | 2.5 |
| 25 | Japan | 57.2 | 3.2 |
| 26 | New Zealand | 56.7 | -0.4 |
| 27 | Spain | 56.6 | 7.3 |
| 28 | Bahamas | 56.2 | 9.8 |
| 28 | Greece | 56.2 | 4.3 |
| 30 | Romania | 56 | 5.3 |
| 31 | Lithuania | 55.9 | 3.2 |
| 32 | Seychelles | 55.6 | 7.0 |
| 33 | Hungary | 55.1 | 2.0 |
| 34 | North Macedonia | 54.3 | 3.6 |
| 35 | Botswana | 54 | 8.2 |
| 36 | Barbados | 53.2 | 12.7 |
| 36 | St Vincent & Gren | 53.2 | 8.9 |
| 38 | Sao Tome & Prin | 52.9 | 7.0 |
| 39 | Antigua & Barbuda | 52.4 | 9.7 |
| 39 | UAE | 52.4 | 15.9 |
| 41 | Bulgaria | 51.9 | 4.6 |
| 42 | Dominica | 51.2 | 10.2 |
| 43 | USA | 51.1 | 3.3 |
| 44 | Namibia | 50.9 | 16.4 |
| 44 | Singapore | 50.9 | 3.7 |
| 46 | Poland | 50.6 | NA |
| 47 | Panama | 50.5 | 9.9 |
| 48 | Portugal | 50.4 | -1.6 |
| 49 | Belize | 50 | -2.1 |
| 49 | Canada | 50 | 4.0 |
| 51 | Gabon | 49.7 | -0.3 |
| 52 | Ukraine | 49.6 | 6.2 |
| 53 | StLucia | 49.4 | 0.3 |
| 54 | Kiribati | 49 | 4.8 |
| 55 | Belarus | 48.5 | 3.5 |
| 56 | Armenia | 48.3 | 4.8 |
| 57 | Israel | 48.2 | 1.9 |
| 58 | Grenada | 47.9 | 7.1 |
| 59 | Trinidad & Tobago | 47.8 | 19 |
| 60 | Cuba | 47.5 | 6.8 |
| 60 | Djibouti | 47.5 | 12.9 |
| 62 | Albania | 47.1 | 9.9 |
| 63 | Montenegro | 46.9 | 8.5 |
| 63 | South Korea | 46.9 | 1.8 |
| 65 | Chile | 46.7 | 6.8 |
| 66 | Ecuador | 46.5 | 9.2 |
| 67 | Venezuela | 46.4 | 0.2 |
| 68 | Costa Rica | 46.3 | 4.0 |
| 69 | Zimbabwe | 46.2 | -0.7 |
| 70 | Suriname | 45.9 | -8 |
| 71 | Brunei Darussalam | 45.7 | 7.4 |
| 72 | Jamaica | 45.6 | -2.0 |
| 73 | Mexico | 45.5 | 12.4 |
| 74 | Taiwan | 45.3 | 7.0 |
| 75 | Central African Rep | 44.9 | -0.7 |
| 75 | Eswatini | 44.9 | 1.5 |
| 77 | Equatorial Guinea | 44.8 | 15.3 |
| 77 | Mauritius | 44.8 | 10.0 |
| 79 | Serbia | 43.9 | 8.5 |
| 80 | Tonga | 43.8 | -3.0 |
| 81 | Afghanistan | 43.6 | 23.9 |
| 81 | Brazil | 43.6 | 5.4 |
| 81 | Jordan | 43.6 | 7.8 |
| 84 | Moldova | 42.7 | -4.8 |
| 85 | Bhutan | 42.5 | -7.9 |
| 85 | Comoros | 42.5 | 1 |
| 87 | Colombia | 42.4 | -0.5 |
| 87 | Kuwait | 42.4 | 15.2 |
| 89 | Dominican Rep | 42.2 | -3.1 |
| 90 | Bahrain | 42 | 5.7 |
| 91 | Cabo Verde | 41.9 | 4.8 |
| 92 | Argentina | 41.1 | 7.8 |
| 93 | Kazakhstan | 40.9 | 11.8 |
| 93 | Paraguay | 40.9 | -6 |
| 95 | El Salvador | 40.8 | 7.6 |
| 96 | Tunisia | 40.7 | 8.1 |
| 97 | Malawi | 40.6 | -4.5 |
| 98 | Guinea-Bissau | 40.2 | 3.5 |
| 99 | Bolivia | 40.1 | 0.6 |
| 99 | Rep of Congo | 40.1 | 6.2 |
| 101 | Peru | 39.8 | -0.4 |
| 102 | Bosnia & Herz | 39.4 | 10.0 |
| 103 | Georgia | 39.1 | 2.6 |
| 104 | Azerbaijan | 38.6 | -1.3 |
| 105 | Guyana | 38.5 | -6.1 |
| 106 | Zambia | 38.4 | -6.9 |
| 107 | Uzbekistan | 38.2 | 1.9 |
| 108 | Thailand | 38.1 | 7.2 |
| 109 | Saudi Arabia | 37.9 | 9.5 |
| 110 | Nicaragua | 37.7 | -0.9 |
| 110 | Niger | 37.7 | -2.8 |
| 112 | Russia | 37.5 | 1.6 |
| 113 | Maldives | 37.4 | 9.0 |
| 113 | Micronesia | 37.4 | -5.9 |
| 113 | Uruguay | 37.4 | 3.3 |
| 116 | South Africa | 37.2 | 10.1 |
| 117 | Tajikistan | 37.1 | -1.6 |
| 118 | Turkmenistan | 37 | 8.9 |
| 119 | DR Congo | 36.9 | -0.2 |
| 119 | Vanuatu | 36.9 | -9.2 |
| 121 | Honduras | 36.5 | 7.2 |
| 122 | Gambia | 36.4 | 5.6 |
| 122 | Samoa | 36.4 | -7.4 |
| 124 | Marshall Islands | 36.2 | 0.7 |
| 125 | Uganda | 35.8 | 3.1 |
| 126 | Kyrgyzstan | 35.7 | 1.2 |
| 127 | Burkina Faso | 35.5 | 2.0 |
| 127 | Egypt | 35.5 | 6.5 |
| 129 | Timor-Leste | 35.1 | -0.3 |
| 130 | Malaysia | 35 | 10.3 |
| 130 | Solomon Islands | 35 | 0.8 |
| 132 | Sri Lanka | 34.7 | -2.6 |
| 133 | Iran | 34.5 | 6.9 |
| 134 | Tanzania | 34.2 | 3.4 |
| 135 | Togo | 34 | -2.4 |
| 136 | Senegal | 33.9 | -0.9 |
| 137 | Qatar | 33 | -2.3 |
| 138 | Cote d'Ivoire | 32.8 | -8.2 |
| 138 | Rwanda | 32.8 | -4.2 |
| 140 | Sierra Leone | 32.7 | 7.2 |
| 141 | Lesotho | 32.3 | 1.4 |
| 142 | Lebanon | 32.2 | -4.7 |
| 143 | Ethiopia | 31.8 | 3.6 |
| 144 | Eritrea | 31.7 | -5.5 |
| 144 | Mozambique | 31.7 | 0.6 |
| 146 | Guinea | 31.6 | 0.2 |
| 147 | Fiji | 31.3 | -3.7 |
| 148 | Kenya | 30.8 | -1.8 |
| 149 | Laos | 30.7 | -1.3 |
| 149 | Oman | 30.7 | 6.4 |
| 151 | Angola | 30.5 | 0.2 |
| 151 | Burundi | 30.5 | -13 |
| 153 | Cameroon | 30.2 | -2.0 |
| 154 | Cambodia | 30.1 | 2.0 |
| 155 | Algeria | 29.6 | -4.0 |
| 155 | Benin | 29.6 | -1.6 |
| 155 | Mongolia | 29.6 | -5.2 |
| 158 | Philippines | 28.9 | -7.5 |
| 159 | Mali | 28.5 | -1.8 |
| 160 | China | 28.4 | 11.4 |
| 160 | Morocco | 28.4 | 2.6 |
| 162 | Nepal | 28.3 | -10.3 |
| 162 | Nigeria | 28.3 | -6.1 |
| 164 | Indonesia | 28.2 | 4.1 |
| 165 | Chad | 28.1 | NA |
| 165 | Mauritania | 28.1 | -3.3 |
| 167 | Guatemala | 28 | -3.0 |
| 167 | Madagascar | 28 | -5.4 |
| 169 | Iraq | 27.8 | -5.3 |
| 170 | Ghana | 27.7 | -6.1 |
| 171 | Sudan | 27.6 | 1.7 |
| 172 | Turkey | 26.3 | -0.5 |
| 173 | Haiti | 26.1 | 2.4 |
| 174 | Liberia | 24.9 | -4.0 |
| 175 | Papua New Guinea | 24.8 | 0.2 |
| 176 | Pakistan | 24.6 | 1.4 |
| 177 | Bangladesh | 23.1 | -1.9 |
| 178 | Vietnam | 20.1 | -0.6 |
| 179 | Myanmar | 19.4 | -3.8 |
| 180 | India | 18.9 | -0.6 |

