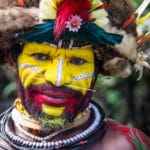
Papua New Guinea is the world’s most diverse country, both ethnically and linguistically. We examine the rankings based on two academic studies
When Sadiq Khan was voted in as London Mayor, he announced his city ‘the most diverse and fantastic in the world’. This triggered interest from the BBC which ran a podcast examining his claim.
The podcast named the Canadian city of Toronto as the most diverse but in doing so, highlighted a number of methodological problems that also apply when measuring the world’s most diverse country.
World’s most diverse country – methodology
How do we define the world’s most diverse country? We could use the percentage of people born in a different country, but this ignores all second- and third-gen immigrants. Indeed, as the BBC points out itself, Mayor Sadiq Khan wouldn’t count towards diversity by this measure as he was born in the UK.

We could use total nationalities in a country but this also presents problems. The UK might have one person from every country in the world, but that doesn’t mean it is diverse as a meaningful percentage of the overall population.
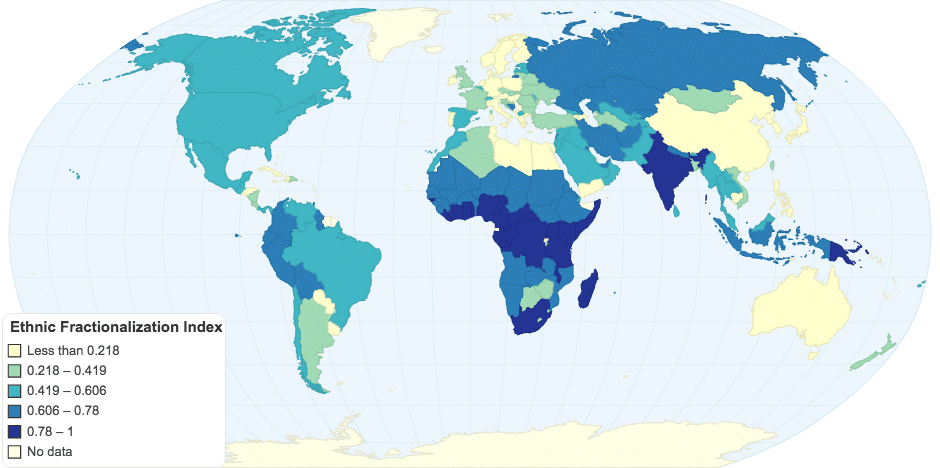
The two foremost studies in the area use ethnic fractionalisation, an approximation of the probability that two randomly selected individuals from a country will not be from the same ethnic group. This leads to a second set of problems: how do we define an ethnic group?
The first of the two studies (Alesina et al, 2003) uses an objective definition of racial groups, namely Encyclopaedia Britannica. Alas, there are some inconsistencies as Britannica published data for only 124 of 190 countries during the years covered, so Alesina et al completed the list with data from other sources.
The second study (Fearon, 2003) attempts to create the “right list” of groups based on “what people in the country identify as the most socially relevant ethnic groupings.” Fearon’s version covers fewer countries but has been acknowledged by Alesina as “closer to what the theory would want”. Fearon’s list is therefore used for our ranking below.
Insights
Papua New Guinea is the most world’s most diverse country. Interestingly, it is also the world’s most multilingual country. North Korea is the world’s least diverse country and is also the world’s least multilingual country, indicating a tight correlation between the two measures.
Seventeen of the top 20 most diverse countries are African. Clearly, Africa is not a massive homogenous entity as so often thought in the west. (‘Africa is not a country’ has even become a meme.)
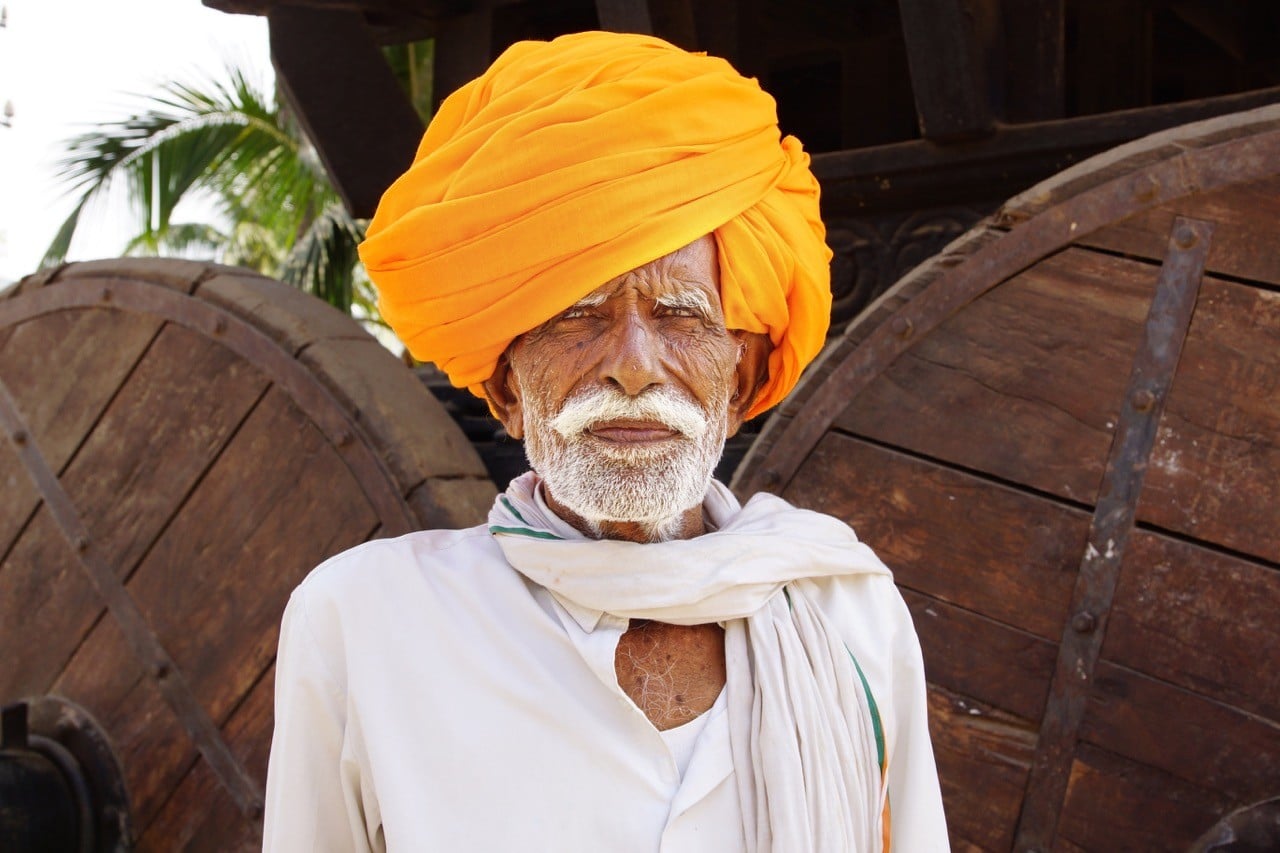
The US ranks at 85th, several positions above the UK which ranks at 109th. Australia, which is famously anti-immigration, ranks close to the bottom at 140th. Interestingly, it ranks higher than 12 European countries, all of which appear in the bottom 20 .
World’s most diverse countries – ranked
| Rank | Country | Score |
|---|---|---|
| 1 | Papua New Guinea | 1.000 |
| 2 | Tanzania | 0.953 |
| 3 | Democratic Republic of Congo | 0.933 |
| 4 | Uganda | 0.930 |
| 5 | Liberia | 0.899 |
| 6 | Cameroon | 0.887 |
| 7 | Togo | 0.883 |
| 8 | South Africa | 0.880 |
| 9 | Congo | 0.878 |
| 10 | Madagascar | 0.861 |
| 11 | Gabon | 0.857 |
| 12 | Kenya | 0.852 |
| 13 | Ghana | 0.846 |
| 14 | Malawi | 0.829 |
| 15 | Guinea-Bissau | 0.818 |
| 16 | Somalia | 0.812 |
| 17 | India | 0.811 |
| 18 | Nigeria | 0.805 |
| 19 | Yugoslavia (1943-1992) | 0.801 |
| 20 | Central African Republic | 0.791 |
| 21 | Ivory Coast | 0.784 |
| 22 | Lebanon | 0.780 |
| 23 | Chad | 0.772 |
| 24 | Indonesia | 0.766 |
| 25 | Mozambique | 0.765 |
| 26 | Gambia | 0.764 |
| 27 | Sierra Leone | 0.764 |
| 28 | Ethiopia | 0.760 |
| 29 | Angola | 0.756 |
| 30 | Mali | 0.754 |
| 31 | Afghanistan | 0.751 |
| 32 | Bolivia | 0.743 |
| 33 | United Arab Emirates | 0.737 |
| 34 | Senegal | 0.727 |
| 35 | Zambia | 0.726 |
| 36 | Namibia | 0.724 |
| 37 | USSR (1922-1991) | 0.711 |
| 38 | Sudan (1955-2011) | 0.708 |
| 39 | Kuwait | 0.708 |
| 40 | Burkina Faso | 0.704 |
| 41 | Bosnia and Herzegovina | 0.681 |
| 42 | Kyrgyzstan | 0.679 |
| 43 | Nepal | 0.677 |
| 44 | Iran | 0.669 |
| 45 | Guinea | 0.669 |
| 46 | Kazakhstan | 0.664 |
| 47 | Colombia | 0.656 |
| 48 | Ecuador | 0.655 |
| 49 | Eritrea | 0.647 |
| 50 | Trinidad and Tobago | 0.647 |
| 51 | Peru | 0.638 |
| 52 | Niger | 0.637 |
| 53 | Mauritius | 0.632 |
| 54 | Mauritania | 0.625 |
| 55 | Benin | 0.622 |
| 56 | Guyana | 0.620 |
| 57 | Djibouti | 0.606 |
| 58 | Bhutan | 0.605 |
| 59 | Malaysia | 0.596 |
| 60 | Canada | 0.596 |
| 61 | Latvia | 0.585 |
| 62 | Syria | 0.581 |
| 63 | Switzerland | 0.575 |
| 64 | Yugoslavia (1918-1943) | 0.575 |
| 65 | Belgium | 0.567 |
| 66 | Fiji | 0.566 |
| 67 | Saudi Arabia | 0.553 |
| 68 | Bahrain | 0.551 |
| 69 | Iraq | 0.549 |
| 70 | Brazil | 0.549 |
| 71 | Mexico | 0.542 |
| 72 | Macedonia | 0.535 |
| 73 | Pakistan | 0.532 |
| 74 | Israel | 0.526 |
| 75 | Burma | 0.522 |
| 76 | Tajikistan | 0.513 |
| 77 | Estonia | 0.511 |
| 78 | Moldova | 0.510 |
| 79 | Jordan | 0.509 |
| 80 | Panama | 0.507 |
| 81 | Czechoslovakia (1918-1992) | 0.505 |
| 82 | Spain | 0.502 |
| 83 | Chile | 0.497 |
| 84 | Guatemala | 0.493 |
| 85 | United States | 0.491 |
| 86 | Georgia | 0.490 |
| 87 | Uzbekistan | 0.485 |
| 88 | Venezuela | 0.483 |
| 89 | Laos | 0.481 |
| 90 | Morocco | 0.479 |
| 91 | Oman | 0.439 |
| 92 | Thailand | 0.431 |
| 93 | Sri Lanka | 0.428 |
| 94 | Ukraine | 0.419 |
| 95 | Nicaragua | 0.402 |
| 96 | Turkmenistan | 0.392 |
| 97 | Singapore | 0.388 |
| 98 | Dominican Republic | 0.387 |
| 99 | Croatia | 0.375 |
| 100 | Belarus | 0.372 |
| 101 | Zimbabwe | 0.366 |
| 102 | New Zealand | 0.363 |
| 103 | Cyprus | 0.359 |
| 104 | Botswana | 0.351 |
| 105 | Lithuania | 0.338 |
| 106 | Russia | 0.333 |
| 107 | Slovakia | 0.332 |
| 108 | Burundi | 0.328 |
| 109 | United Kingdom | 0.324 |
| 110 | Czech Republic | 0.322 |
| 111 | Algeria | 0.320 |
| 112 | Romania | 0.300 |
| 113 | Turkey | 0.299 |
| 114 | Bulgaria | 0.299 |
| 115 | Swaziland | 0.280 |
| 116 | Taiwan | 0.274 |
| 117 | France | 0.272 |
| 118 | Mongolia | 0.272 |
| 119 | Lesotho | 0.255 |
| 120 | Argentina | 0.255 |
| 121 | Costa Rica | 0.238 |
| 122 | Vietnam | 0.233 |
| 123 | Slovenia | 0.231 |
| 124 | Bangladesh | 0.223 |
| 125 | Uruguay | 0.218 |
| 126 | Cuba | 0.213 |
| 127 | El Salvador | 0.198 |
| 128 | Sweden | 0.189 |
| 129 | Azerbaijan | 0.188 |
| 130 | Hungary | 0.186 |
| 131 | Cambodia | 0.186 |
| 132 | Honduras | 0.185 |
| 133 | Rwanda | 0.180 |
| 134 | Ireland | 0.171 |
| 135 | Jamaica | 0.166 |
| 136 | Egypt | 0.164 |
| 137 | Philippines | 0.161 |
| 138 | China | 0.154 |
| 139 | Libya | 0.151 |
| 140 | Australia | 0.149 |
| 141 | Armenia | 0.134 |
| 142 | Finland | 0.132 |
| 143 | Paraguay | 0.132 |
| 144 | Denmark | 0.128 |
| 145 | Austria | 0.126 |
| 146 | Norway | 0.098 |
| 147 | Albania | 0.097 |
| 148 | Germany | 0.095 |
| 149 | Haiti | 0.095 |
| 150 | Yemen | 0.078 |
| 151 | Netherlands | 0.077 |
| 152 | Greece | 0.059 |
| 153 | Poland | 0.047 |
| 154 | Portugal | 0.040 |
| 155 | Italy | 0.040 |
| 156 | Tunisia | 0.039 |
| 157 | Japan | 0.012 |
| 158 | South Korea | 0.004 |
| 159 | North Korea | 0.002 |
Source: Fearon, 2003


